Posts

Showing posts from January, 2012

Central banks shifting to gold

Image
There has been much talk about central banks becoming net buyers of gold since the start of the economic crisis in 2008. I want to elaborate on that. The world gold council (WGC) yearly reports on the amount of central bank gold sales. As of 2010, central banks have shifted from net sellers to net buyers of gold ( Figure 1 ). And this has only happened recently! As we look at history, during the inflationary years of 1980, central banks were buying gold. Then a period of gold selling occured from 1989 till 2009 where gold went into a bear market. Central banks only shifted to buying gold since 2010. Which means we are going straight back into a bull market of gold. Figure 1 The WGC expected growth in gold buying from central banks to continue throughout 2012 . The projected growth of central bank gold buying was projected to be 336 tonnes of gold per year in 2011 ( Figure 2 ). Their predictions were right as central banks added 450 tonnes during 2011 . Figure 2 By far, the increase in...

Agriculture turning around?

Image
At the beginning of 2012 agriculture prices are starting to turn around after the big correction that occured in 2011. Speculators have started to add net long positions in agriculture due to drought concerns in South America. Global demand is still going up. Soy Bean prices are going up on dry weather in Brazil and Argentina. Palm Oil prices benefit from the problems in the Soy Bean crops. Cotton prices are improving but are still weak. Cotton prices are bottoming out though. The rubber market is likely to continue the uptrend due to bad weather conditions. Demand for rubber is strengthened by the buying up to the Lunar New Year. Wheat prices are still weak due to large wheat production. Coffee prices had a surge in 2010 and were correcting in 2011. Prices will remain firm though due to supply shortages. Sugar is in an uptrend, but speculators are turning bearish. Corn prices are weak due to a surplus in inventory, but seem to be bottoming out. Rice prices are turning in a do...

Chinese buying copper

Image
At the London Metal Exchange (LME) the copper stock levels keep declining as can be seen on following graph: LME Copper warehouse level The Chinese were importing copper at record levels during December 2011 to restock their inventory. There has been a concern that in 2012, there will be a copper deficit , which resulted into this buying frenzy. As a result we can see that since September 2011 the copper price was going up, just at the same time that LME stock levels were going down. Copper price I can't blame the Chinese to buy copper, they want real assets and not some US government paper, which they are dumping by the way as can be seen on following graph: China US treasury holdings I think the buying frenzy is not over yet, as China is positioning itself to create competition against the London Metals Exchange in June 2012. On that date China will open the Pan Asia Gold Exchange , also known as PAGE, challenging the LME and COMEX. I predict that gold and silver will explode on ...

Belgium Downgraded by Fitch

Image
Today Belgium was downgraded by Fitch from AA+ to AA with negative outlook. All of this due to the Dexia fiasco. I'm from Belgium and I can say that the bailout of Dexia was the most immoral thing the government has ever done. Dexia has an enormous amount of Greek debt (US$5 billion write down)  and everyone knows Greece is going to default sooner than later. Supporting Dexia was the dumbest act ever. The only reason why Belgium government bonds are doing well is because Belgians have an enormous amount of savings and the unemployment rate is improving. But we see the consequences already from Dexia. Several cantons lost several millions of money. Of course, we tax payers will need to pay for this. Amount of shares in Dexia per capita 4 other countries were downgraded as well: Italy: A => A- Spain: AA- => A Cyprus: BBB => BBB- Slovenia: AA- => A Surprisingly, the euro went up...

Gold Spike?

Image
Today there was this large gold spike to 2263.65 EUR/oz during New York Globex time. I have no idea what this phenomenon is. If somebody could point out what this is, it would be really helpful. Maybe it's an omen of what is yet to come! Spot gold in EUR/oz

Baltic Dry VS Copper

Image
Commodities like copper are correlated to the Baltic Dry Index  or Dry Bulk Rates . Old post: The last few weeks we see that the Baltic Dry Index  has been dropping while copper prices surge. How can this be? Is the economy slowing down as evidenced by the falling BDI, or is the economy growing as evidenced by the rising copper prices. Nobody really knows. My take on this is that the economy actually is growing, on phony money that is (or you can equally say the money supply is increasing). What is happening to the BDI though, is a consequence of the massive creation of ships during the period of 2005-2008 . BDI VS Copper While the BDI may keep falling, the copper price is steadily going up, together with the S&P. The chart below shows the high correlation between copper prices and the S&P. S&P VS Copper Another evidence of the improving economy can be seen in the BullandBearwise index, which measures the performance of key macro-economic metrics (capacity utiliza...

The Fed will never increase interest rates again

Image
Today Ben Bernanke said he would keep the benchmark rate essentially at zero percent till 2014 . Earlier he said he would keep it at zero percent till 2013 . My take on this is that they will never increase interest rates again, until the whole system collapses. Marc Faber already pointed this out in 2010 . Look at what effect it has on the silver and gold price... To see the whole interview, see below:

USD is losing reserve currency status

Image
It is apparent in the timeline below that the whole world is trying to back away from the "reserve currency" of today: the US Dollar. More and more political games are going to be played and this will eventually result in the Great War of our century (as Gerald Celente calls it). It all started in end 2010 but the games are accelerating. If you pay attention to the countries involved, you will see that Asia itself is trying to create an Asian reserve currency. Here's what is happening: 24 November 2010 : Russia and China want to back away from the USD to lessen their dependencies on the US dollar. They will try using their own currencies for settlement. 24 July 2011 : China wants to export their goods to Iran in exchange for oil. Thereby bypassing the USD and US financial sanctions. (that is also why USA is trying to go to war with Iran, just to make it more difficult for the Chinese) 25 December 2011 : China and Japan promote direct trading in yuan and yen to reduce cost...

Capacity Utilization update

Image
The Capacity Utilization rate in the US for total industry (Dec 2011) was released today at 78.1%. This means that we're still in an uptrend, which is bullish on gold and silver. Speaking about silver: PSLV (Sprott's silver trust) today dropped almost 10% today, I'd say this is a very good price to start accumulating physical silver. Capacity Utilization (BullandBearwise) Historically when capacity utilization rates go to 80%, a year later we get a spike in inflation. So there is a high correlation between capacity utilization and inflation. If you don't know what capacity utilization is, you can follow these two videos from Salman Khan on the capacity utilization - inflation correlation here:

Buying vs Renting

Recently I had a heated discussion about which one is better: buying a house or renting a house. I kept saying that renting a house was cheaper than buying a house and here's why: - The government will not keep subsidizing your loan - Housing prices will not forever keep going up faster than the rise of wages - Gold will increase much faster than real estate due to inflation - Taxes on property are high and will keep increasing - Maintenance on property needs to be paid by the owner of the house  - Mortgages will rise in interest rate and will collapse the price of houses I found a nice site that calculates the expenses:  Renting VS Buying If we make following assumptions: - The average rent of an appartment in Belgium: 715 euro/month (2010) ( house rent ) - The average price of an appartment in Belgium: 215000 euro (2010) ( house price ) - Inflation rate: 3.5% - Mortgage interest rate 5.5% - 30% down payment - Rent inflation 3.5% - Interest on investment in gold: 5%/year (gol...

M1 and M2 still rising

Image
M1 is the total currency in the banks + checking accounts. M2 = M1 + savings accounts, funds Money supply measures the amount of currency in circulation in the economy and is, as a consequence, a measure of future inflation. If you would think that the government isn't still printing money, I need to dissapoint you. M1 and M2 are still rising at an exceptionally fast pace. Which is very inflationary in the future. M1 is at 2.23 Trillion USD M2 is at 9.75 trillion USD

Baltic Dry drops

Image
The Baltic Dry Index is an index of dry shipping lease rates. It reflects how much it costs to rent a freighter for hauling non-liquid raw materials. There is a high correlation between BDI and the Chinese economy. If the BDI drops, the commodity trade drops, together with the Chinese economy. The last few weeks the Baltic dry Index dropped quite a bit, which indicates a slowdown in the Chinese economy with its commodity trade. Even the Panamax and Supramax (for smaller ships) is dropping, which confirms the slowdown in every sector of the freight transport economy. This will be bad for industrial commodities going forward. I wouldn't rule out silver correcting downwards, if this trend continues. A possible reason for this drop could be the drop in prices of Chinese properties as can be seen on the Shanghai Property index:

Belgium housing bubble

Image
The Economist has a nice interactive tool to monitor the house prices from 1975 till 2012:  http://www.economist.com/node/21009954 A few interesting observations can be made: Belgium, where I'm living, is still in an upward trend in housing prices (Chart 1), while this can't be sustainable if we look at house prices against average income (Chart 2). Historically housing prices can only go up when wages go up, because you can't buy a house when you don't earn enough money to buy it/pay it off. I am expecting a similar drop in housing prices in Belgium like what has happened in the US in 2008. In the United States, we see the collapse starting in 2007 and bottoming out in 2009. In Japan, we see that house prices are becoming really cheap for Japanese people to buy, which is actually a good thing. In Hong Kong we also seem to have a housing bubble forming. Chart 1: House prices in real terms Chart 2: House prices against average income

Katchum's Economic Intermezzo

Image
Welcome! If you are reading this article, you will be one of a few privileged people, able to prepare for the tsunami that's coming to us. We live in one of the most exhilarating times of the past few centuries and that's because the future, starting from 2012, will never be the same as before. We are faced with the limits of our existence concerning debt, money supply,  commodities, exponential growth, population, energy and war. If you haven't seen this curve of base money yet, it's time to take notice of it (Chart 1).  This chart shows the amount of base money (billion USD) that has been printed by the federal reserve. It was relatively flat in the beginning of the century and started to move upwards in the 1970's when the gold standard was abandoned. But it really started to explode in 2008, during the financial crisis that we all have experienced ourselves. This is the first sign of coming inflation. Our money will diminish more and more in value because money ...

Government Bond Yield Extremes

Image
Today I found an interesting article on Bloomberg about 1 Year German government bond yields going under zero (see Figure 1). It is amazing that people want to lend money to the German government while paying extra money (1% of their investment) a year from now. Thereby losing money with their investment. I can think of only one reason for this and that is: "your money is not safe in the bank". Why would someone not just put their savings in a bank which pays around 1,5 % yield a year. Instead they want to lose money by buying German government bonds. Exactly because your cash is not safe in your bank. At any time your bank will go bankrupt. I know Germany is a safe haven, but there are far better alternatives here like buying precious metals: gold and silver. Figure 1: The 1 year US government bond yield is really almost the same. Amazingly low yields with minimal return in an inflationary environment (see Figure 2). Figure 2: Completely the opposite is the 1 year Greece Gov...

PSLV silver premium analysis

Image
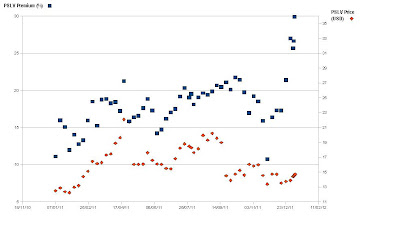
Today I fabricated a nice chart of the PSLV price (Right Y-axis) and the PSLV premium (Left Y-axis) from the beginning of 2011 till today. I calculated this as follows: I first calculated a standardization coefficient based on the premium, price of PSLV and SLV of 30 December 2011. The standardization coefficient was 2.55 (30 December 2011) and 2.5 (5 January 2012). If I had the historical premiums I could make an average standardization coefficient. The problem is that I don't have the data for historical premiums of PSLV...  So we'll just go with this premium here to calculate Stand. coefficient (30 December 2011):                                                    SLV price  Stand. coefficient = --------------------------------------------------------                           ...

Marc Faber - Slovenia Conference (2009)

This is an old video from the 2009 Slovenia conference, but an all important one. Marc faber talks about the macro-economy in a global market. He will talk about economic cycles, commodities, bonds, real estate, emerging markets, gold and war. As debts are skyrocketing it becomes increasingly clear that gold is the only safe haven. Abstract: - We are in the up move of the Kondratieff cycle - Bonds are the worst investment - Asia has all the money - US trade deficit will become hyperinflationary - Emerging markets will consume more - Gold is a safe haven - War is coming - Commodities will become scarce