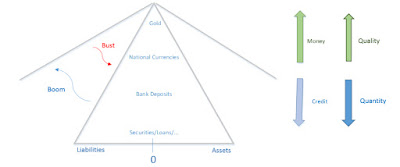
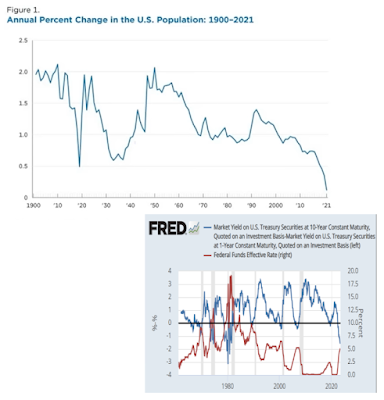
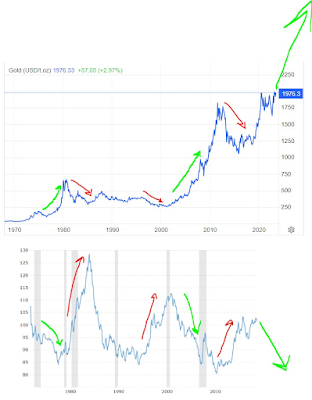
The natural hierarchy of money starts with gold at the top. Everything else is credit. Gold Currency Deposits Securities As credit expands and contracts, the pyramid grows wider and narrower. In a credit expansion, liquidity flows from gold to credit and vice versa. The federal reserve can increase the expansion cycle by inducing elasticity and lowering interest rates. The yield curve uninverts. Liquidity flows from gold into securities (stocks and bonds). Conversely, the federal reserve can induce scarcity and a credit contraction by hiking interest rates. The yield curve inverts. Liquidity flows from securities into gold. A rate hiking cycle leads to gold outperforming stocks. A rate cutting cycle leads to stocks outperforming gold. This happens with a delay. An inverted yield curve leads to a rising gold price as liquidity flows from securities into gold. This all leads to the concluding chart which connect the prices of money with the hierarchy of money: