Posts

Showing posts from June, 2012

Iran Oil Embargo: Russia and The Baltic Dry Index Benefit

Image
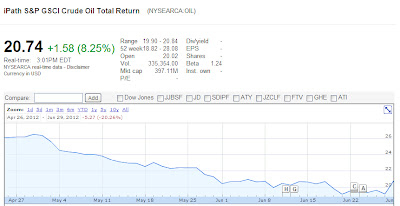
Albert's Animation I really love macroeconomics, especially when it's about political themes. This Sunday 1 July 2012 Europe is starting a full oil embargo against Iran. It will not import oil from Iran. Iran will lose 30% of its exports, while Europe loses 6% of its oil imports. This means tight supply of oil and a rising oil price (8%) as a consequence. Chart 1: Crude Oil Price Oil imports into Europe can be found here:  http://ec.europa.eu/energy/observatory/oil/import_export_en.htm Table1: Oil Imports to Europe You can see that the biggest oil exporter to Europe, namely Russia (30%) will be the ultimate winner here. Iran will definitely close the strait of Hormuz  now. 20% of worldwide oil trade would be disrupted, the baltic dry index would spike and energy costs will rise.

Gazprom: Betting on Russian Natural Gas

Image
Gazprom is the world’s largest gas business engaged in natural gas, gas condensate and oil prospecting, production, transmission, processing and marketing both inside and outside Russia. I have been very bullish on Gazprom  ( OGZPY.PK )  in January 2012 because the fundamentals of this company were very positive. You can read my previous analysis here . I noted that Gazprom was severely undervalued and had a P/E of 3.5, handed out a dividend of 2% and had a price to book value of 0.6. Since that article, the stock price of Gazprom has gone down 15% (Chart 1). I recognize that was a bad call. The decline has much to do with the worsening conditions in the Eurozone. So what has actually changed for Gazprom since January 2012? Read the full analysis here. Chart 1: Gazprom (Micex)

Euro Strength Finally Manifested

Image
I have been monitoring the euro versus U.S. bonds versus S&P. U.S. bonds have been very volatile, one day they go up and the other day they go down. There is no consistency whatsoever in U.S. bonds (green triangles). The euro has been relatively flat against the U.S. dollar, but it posted the biggest increase since I started monitoring it the previous month (blue dots). I hope this will be the first sign of euro strength, which means commodities could start rising. The S&P started to go down lately, but today it was pretty bullish. There is no decoupling yet: when the U.S. dollar goes down, stocks go up. Chart 1: Monitoring of EUR/USD VS. 10 Yr US Bonds VS. S&P

Silver Net Short Positions Lowest in a Decade

Image
Today, as I navigated on GoldMoney's website , I learned a little bit about swaps and net short positions in silver. So I searched for keywords like swap and net short position and came to a very interesting website named Gotgoldreport.com. I wanted to summarize in short what I read there. Apparently physical silver is headed higher and this can be deducted by the net long swaps, which are at their highest point from at least 2006 onwards. You can see that in September 2007, the silver price shot upwards from $US 13/ounce to $US 20/ounce when the swaps position declined. The same happened in 2009. Now the same will happen in 2012: when swaps (blue line) goes back down, you need to prepare yourself for a move upwards in the silver price. Chart 1: Swap Dealer Net Position Silver The second indicator is the net short position of the large commercials (LCNS) (Chart 2). Blue line is the LCNS, pink line is the silver price. There has never been so few net short positions in the commercia...

Copper Turns Back to Contango: Bearish for Copper Price

Image
In a previous article I pointed out how copper contango/backwardation correlates with the copper price. Since June 11th 2012, copper went back into contango which isn't boding well for copper prices (Chart 1). The China PMI is also going down lately, which means demand for commodities from China will be sluggish. As copper correlates with the S&P, I would imagine that stock markets will go down as well in the future. So investors should act accordingly and sell equities at this moment. Chart 1: Copper Contango Curve

China Increases U.S. Treasury Holdings in April 2012

Image
China has been increasing its U.S. bond holdings in April 2012 (Chart 1). Not much news here. What's very important to know is that China has actually decreased its short term U.S. bond holdings by 5.1% . China holds $US 3.7 billion short term U.S. paper. On June 2011 China held $US 4.9 billion of short term U.S. paper. So basically all the debt that China holds are long term treasuries now. Interesting to know, China had $US 200 billion in short term U.S. debt in May 2009. So they divested all short term paper to long term paper. In one of my previous articles I pointed out that short term debt is the most risky asset today, and it's being held mostly by foreigners. When the bond bubble implodes, the defaults will start with short term debt. That's also why the federal reserve is enacting Operation Twist II to sell short term paper and buy long term paper. But China is smart enough not to buy those short term bonds... Chart 1: China U.S Treasury Holdings

Marc Faber: Gold Has Bottomed Out

Image
According to Marc Faber, it's better to invest in corporate bonds than treasuries. Even equities in Asia will do better because of the high dividends, which are around 5-7%. He also believes that gold has bottomed out at these levels.

CME: Silver Stock Growing, Gold Stock Flat

Image
Time for a gold and silver stock update at the COMEX. In a previous article I noted that silver stocks were historically low. But recently silver stocks have been rising at the CME, which isn't bullish for the silver price. It means that silver isn't being used as much as a month ago, indicating a slowdown in the economy (Chart 1). Silver has been stocked up in the warehouses. Chart 1: CME/COMEX silver stock (Troy ounces) (red eligible, blue registered, green total) As for the gold stock, the total amount of stock at the COMEX has been flat for a month now (Chart 2). If we compare gold stocks against silver stocks, this means that gold is doing much better than silver in strength. Chart 2: CME/COMEX gold stock (Troy ounces) (red eligible, blue registered, green total) Notable is the little spike in registered silver on Chart 1 in the beginning of May, and the little spike in registered gold on Chart 2 in the beginning of June.

How do we know when it's time to sell our gold?

Image
I have pointed out previously how James Turk uses his Gold Money Index to estimate the fair value of gold. You can read it in this article . In that article we estimate that gold should be at $US 10000/ounce in 2011 if we compare the gold price to the amount of foreign currency reserves held by the central banks around the world. To read the full analysis go to:  HERE . Chart 1: Gold Price Estimates

An Analysis on the Oil Price

Image
Since May, the price of crude oil ( OIL ) has fallen from $US 106/barrel to $US 78/barrel (Chart 1). It is very likely that the price of crude oil will continue to decline because for the first time in a decade, supply is exceeding demand. In this article I will give advice to investors on how to play the oil price and I will give critical information on when to buy the dip in crude oil based on a fundamental analysis of crude oil production costs. Chart 1: Crude Oil Price

China Buys Out London's Crown Jewel

As China becomes more and more a leader in the global economy it is not only purchasing the largest amounts of commodities, but is also starting to buy up strategic assets. This time China bought a legacy of 135 year, right in the heart of London. Over this weekend (16 June 2012), China bought out the London Metal Exchange (LME) for 1.38 billion pounds . This means that J.P. Morgan, Goldman Sachs and Metdist are giving up on their shares of the LME. The LME is now part of the Hong Kong Exchange (HKEx). This event will increase China's monetary flexibility on the base metals front. It is an important addition to China's assets because China is the largest consumer of commodities in the world. The LME isn't a small exchange as it has an 80% share in global futures trading in key base metals like aluminum, copper and zinc. The plans for China with the LME acquisition is to incorporate more Chinese companies on the exchange and to introduce Chinese currency based contracts trad...

Capacity Utilization Rate May 2012 Flatlined at 79%

Image
The newest number on capacity utilization is 79 % for the total industry in May 2012. This is basically the same as the previous month. Interestingly, the capacity utilization for the mining industry is much higher at 89.2 %, up from 88.5 % the previous month. This is positive for the mining shares.  Utilities inched up to 76.5 % from 76 % the previous month. Chart 1: Capacity Utilization Rate

The Effect of Government on the Economy of a Country

I believe government is an important institution to keep order in a society of a country. It should focus mainly on the country's defense and should obey the constitution of the country. By no means it should involve with the economy of a country as the government is always less efficient as free market capitalism. Governments should be as small as possible, in order to let the private economy flourish. Today, governments are standing in the way of free market capitalism through taxation, regulations and counterproductive measures. What governments don't know are the unintended consequences they cause. I'm sure that governments are the root cause of all the problems in Europe and soon in the United States. In this article I want to give an overview of several countries and their government involvement. The best measure to rate government involvement would be the amount of spending as a percentage of the country's GDP. We will discuss the effects of a big government on ...

An Analysis of U.S. Treasury Maturities

While many investors want to believe that U.S. treasuries ( TLT , DTYL ) are a safe haven, I will use this article to debunk that myth with plain hard evidence. I believe holding U.S. bonds is the worst investment going forward. I will make an in depth analysis on debt maturities in this article . I think all investors need to be aware of this trend that indicates looming default in U.S. bonds.

Gold Reserves: When Will China Catch Up With The US?

Let's see how long it will take for China to be number one in gold reserves. The latest data (end of 2011) on gold reserves is given below (CNBC): 1. United States: 8,965.6 tonnes 2. Germany: 3,743.7 tonnes 3. IMF: 3,101 tonnes 4. Italy: 2,702.6 tonnes 5. France: 2,684.6 tonnes 6. SPDR Gold ETF GLD: 1,213.9 tonnes 7. China: 1,161.9 tonnes 8. Switzerland: 1,146.5 tonnes 9. Russia: 960.1 tonnes 10. Japan: 843.5 tonnes We already know China bought approximately 240 tonnes gold since 2012 started. This puts China's gold reserves at 1400 tonnes. If China were to buy more than 100 tonnes of gold each month and if we assume that the United States doesn't increase its gold reserves, China will catch up with the United States in approximately 6 years and 3 months. So in late 2018 China will have the largest gold reserves in the world and at the same time it will have the largest foreign exchange reserves in the world.

Peter Schiff Interviews CEO Bradford Cooke (Endeavour Silver) at the Euro Pacific Global Investor Conference (31-May-2012)

Image
Peter Schiff Interviews Brad Cooke of Endeavour Silver at the Euro Pacific Global Investor Conference: The highlights of that interview are summarized as follows. According to Bradford Cooke, the company has been growing reserves over the years, and production has almost tripled since the economic crisis hit in 2008. In February 2009, Endeavour Silver went to the market through Euro Pacific Capital (Peter Schiff's company), and equity dilution was less than 10%. The company has also built its employees over the years, growing from a small company to a mid tier company with 2700 employees, including contractors. Working capital is $US 175 million at this time. Last year, cash costs were $US 5/ounce. By expanding its gold production, the company can keep bringing costs down. Their most interesting project is the recently acquired El Cubo mine in Mexico, which is the next leg upwards in this growth story. The P/E is around 10 right now ($US 20 million earnings per quarter) and Price/C...

Silver Rally Expected in Second Half of 2012

Image
The silver price is closing in on a critical wedge pattern (Chart 1). I expect the silver price to rally in the second half of this year. If you haven't bought yet, I suggest this is the right time to do so. Chart 1: Silver Price To add even more rumors to the silver price, on King World News , a London trader reported that there was a huge Eastern buyer of silver three weeks ago. He bought a staggering amount of silver around $US 27/ounce. So everything is pointing to higher prices.

Peter Schiff Testifies Before Congress

Image
Peter Schiff testifies for a second time in front of Congress. This time it's about housing.  You can cut the first 50 minutes if you want to hear Peter. I was a little disappointed by the fact that there were so many speakers this time, so there was less time for real discussion. Additionally, it became boring at a point. They were just reading their speech, which is available on the internet itself. So you could just go to the Financial Services Committee site and read the letters. But still, it was a very interesting speech by Peter, who of course didn't need a letter in front of him to speak his mind. To see the previous hearing in 2011, you can watch this video below:

Real Deflation Confirmed by Mike Maloney

Image
In this video, Mike Maloney confirms that deflation has already set in. If we subtract base money (balance sheet fed) from M2, we get a 25% contraction. This has never happened before since the Great Depression and it evidences the fact that quantitative easing doesn't work. It just stays on the balance sheets of the banks. And we all know what comes after real deflation, hint: it starts with an "H".

Who is Holding the U.S. Bonds?

Image
These days, we hear much talk about how low the interest rates are on U.S. government bonds ( TLT , DTYL ). Many say that this is because the Federal Reserve is printing money to buy up its own bonds. But actually, it's the foreigners that are buying up all the treasury debt. In this analysis I will go through the most recent facts about U.S. government bonds and we will see that one of the most important charts to follow is this one. It will tell you the exact time when to sell U.S. government bonds. Chart 1: Debt held by Foreigners

Peter Schiff: Fraser Institute Vancouver 5 June 2012

Image
Peter Schiff at the Fraser Institute in Vancouver on 5 June 2012.

The Status on China

We already know China is slowing down, because their imports of key commodities have been going down lately. I summarized this already in this article . We saw that industrial commodity imports were declining, while gold imports and U.S. treasury buying skyrocketed. I believe China has enough tools to keep their real estate and stock markets from falling. To find out how,  go to my analysis here .

China U.S. Treasury Holdings March 2012

Image
Time for a China U.S. treasury holdings update. Apparently the February release of China's holdings of U.S. bonds was revised downward from $US 1.17 trillion to $US 1.155 trillion. But in March, China recorded the highest amount of treasury holdings, namely $US 1.17 trillion (Chart 1). So China isn't only buying record amounts of gold, but at the same time is continuing to buy U.S. treasuries. Where on earth does China get all this money from... Right, because of production and savings. Chart 1: China U.S. treasury holdings (billion USD)

China is Buying Record Amounts of Gold

Image
As I already feared, China is scooping up all the gold in the world and is becoming the foremost gold buyer in the world. Trying to get more and more exposure to the reserve currency status. Today it was released that China imported approximately 104 tonnes , a staggering amount of gold! The chart looks something like this: Chart 1: China Gold Imports From Shanghai Daily: GOLD imports by China's mainland from Hong Kong rose 65 percent to a record in April, up for a third straight month as investors sought a hedge against financial market turmoil and an economic slowdown. Shipments totaled 103,644.5 kilograms in April from 62,913 kilograms in March, according to export data from the Census and Statistics Department of the Hong Kong government yesterday. In the first four months, imports were 239,174 kilograms from 27,114 kilograms a year earlier, according to Bloomberg News calculations. China doesn't publish such figures. Increased imports by the second-largest consumer after I...

World Market Window: New Tool to Monitor the Global Economy at A Glance

Look at the new tool I got: =>  World Market Window Very interesting tool to monitor commodities, bonds and equity markets. Just like a real brokerage screen.

USD VS. S&P VS. 10 Yr U.S. Bonds: Decoupling Monitoring Experiment

Image
Peter Schiff told us that when the USD and the stock markets decouple (meaning U.S. dollar goes down and stock markets go down), U.S. bonds will plunge. I will now start to monitor this coming event. Today we have the first day of the experiment and we already see that such event is happening. - U.S. dollar declined against the euro: down 0.5%. - Stock markets are down: S&P down 0.4%. => Resulting in a bond market plunge of: 3.5% to a 1.5% yield on the 10 year U.S. bonds. Table 1: USD-S&P-Bonds Decoupling Monitoring Experiment Charts will follow as we start monitoring this trend.

Another Correlation: Case-Shiller Index VS. Housing Market Index

Recently, we saw bullish indicators for housing demand. At the same time we saw bearish indicators for housing prices. Let's take a deeper look at the overall trend of the two indices HMI and Case-Shiller Index and see which correlation can be found. You can read the analysis here:  Case-Shiller Index VS. Housing Market Index .

Peter Schiff: When Will It Hit The Fan?

Image
Here's an update from Peter.  The most important sentence in this video was about decoupling of the U.S. dollar and stock markets. Normally, stocks go lower and the U.S. dollar goes higher. But once the decoupling of this correlation occurs, then the *you know what* will hit the fan. After that event, U.S. bond markets will plunge.

Is China Slowing Down?

These days, many commodity investors are living in uncertainty because they read on the internet that China, the largest consumer of commodities in the world, is slowing down. In this article I will take a look at the most important commodities consumed by China. We will see if our concern about China slowing down is validated. China is already the world's largest consumer of the main industrial metals copper, nickel and zinc. In the energy space, China is the largest consumer of coal in the world. In construction, China is the largest cement (+ ceramics and plate glass) consumer in the world. In the precious metals industry, China is the largest gold and platinum jewelry consumer in the world. Indeed, a slowdown of China will have a large impact on commodity prices. In the full version of this article I will go through the commodities listed above and we will see that China is indeed slowing down.

How Gold Mines Will Benefit From the Second Great Depression

During the Great Depression in 1932, gold went up while utilities (energy, oil) went down. Oil companies were almost all going bankrupt. What happened to gold mines then? Every company has revenue and costs. Revenue from a gold mine comes from the gold they mine and sell. This asset was very precious to people, so gold mines benefitted from the gold price going up. Costs were going down as oil went down due to the worsening economic outlook during the Great Depression. So, when revenue goes up and costs go down, margins start to increase a lot. This is what happened during the Great Depression and this will happen once again now. To find out, go to:  How Gold Mines will Benefit from the Coming Depression