Posts

Showing posts from January, 2014

2013 A Magnificent Year For China Gold Imports

Image
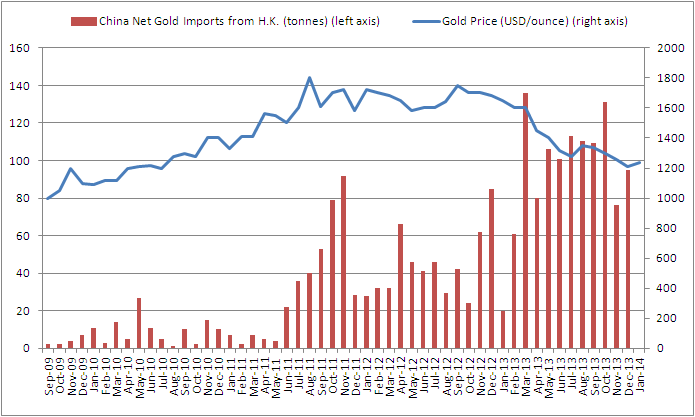
In 2013, China imported net 1140 tonnes of gold from Hong Kong. Which is a huge increase (110%) from the 532 tonnes imported in 2012. Other than Hong Kong, China also imported approximately 420 tonnes from other countries. So total gold import to China is around 1600 tonnes. If gold production ex China is around 2300 tonnes, then China imports almost all the gold that the world produces (ex China). The gold price went from $1700/ounce (2012) to $1300/ounce (2013) on average. That's a decrease of 25%. So a 25% drop in gold price makes the Chinese buy double as much gold. If the gold price were to drop another 25% to $1000/ounce, then China would import 3200 tonnes a year which exceeds global mine supply of 2300 tonnes (ex China). This is of course not sustainable and that's why gold can't go to $1000/ounce. It's virtually impossible. Do as Marc Faber says and buy the junior gold mines GDXJ (cfr. Barron's Roundtable).

J.P. Morgan COMEX Gold Unwinding Continues

Image
Remember when I posted breaking news here about the COMEX unwinding? It has just accelerated and it's again J.P. Morgan who is unwinding. At this rate, I give it until mid March 2014 until it implodes.

Peter Schiff Bought Gold Mine in December: Up 80% In 1 Month

Image
Something interesting that I heard on the Peter Schiff Show. Peter bought a gold mine in December and is up 80% right now. I looked at all gold mines out there and I could only find 3 gold mines: 1) Rubicon Minerals 2) Lakeshore Gold 3) Pretium Resources  Any guess which one he bought?

Copper Price in Neutral Territory, Though Slightly Negative

Image
Historically, when the copper contango is high (red chart tops out), then we have a bottom in the copper price (blue chart bottoms out). We see that the red chart has already topped out and the copper bottom is in. The problem now is, we are in neutral territory. We are slightly in backwardation which makes me less bullish on copper. Not much action in CFTC report, pretty neutral. But on the COMEX, the copper stock level is rising again pointing to a move to contango, which could mean that the copper price will go down. This is why I sold my copper equities a few days ago. Right at the top. The copper miners weren't doing well recently.

Mt. Gox Laying Off People?

Image
As Mt. Gox is laying off people , I ask myself the question, why are they laying off staff? Is this just a hoax? Is the ponzi scheme falling apart? Are they about to shut down? Or is it just a little bit of cost cutting.

Ask The Expert: Peter Schiff

Image
Listen to Ask The Expert on Sprott Money featuring Peter Schiff. Part 1: Part 2: Part 3:

Paper gold pyramid scheme unwinds right now

Image
Pretty breaking news in the COMEX is that we are seeing a start in the unwinding process of leverage in paper gold. Zerohedge reports that J.P. Morgan got its largest drop in eligible gold in one day. This is how it looks like. Of course with so few real physical gold at the COMEX, the whole paper pyramid scheme will collapse in a jiffy. And the leverage which will collapse too (still a long way to go down), is shown below. When everything unwinds, the paper shorts will have to come up with the real gold as China buys an ever increasing amount at the SGE. This week the SGE had a record delivery of 59 tonnes, the second highest after the 79 tonnes we got last week. Add to that the most probable import tax restriction easing of the Indian government and we have the perfect storm for gold. I even sold my copper stocks to buy extra gold mining shares. And I didn't even mention the end of manipulation by Deutsche Bank, the increasing investments from China in the gold mining sector and...

China Central Bank Gold Holdings Don't Match

Image
Today China came out with their Central Bank Gold Holdings . They reported 1054 tonnes as always since 2008. But this is impossible. Here is why. China imports gold and also produces gold. This total addition in gold has surged since 2008 (white bars), due to the imports through Hong Kong. China consumes 60% of its gold in jewelry, the other 40% is added to the central bank gold reserves. This implies that we have 2710 tonnes instead of 1054 tonnes. That's almost 3 times the reported number from the Chinese government.  China Gold Reserves Additionally, the total assets of the Chinese central bank has gone up from 3 trillion to 6 trillion from 2008 till now, which is a doubling of the balance sheet.  And you tell me that they didn't buy any gold since 2008? I believe they want to quietly buy more gold...

Unemployment Is Not A Bad Thing

Image
Some people actually do enjoy unemployment benefits and I'm serious.

China Power Consumption Accelerating

Image
As predicted here , China's power consumption is making progress. December 2013 was a good month with a power consumption of 488.5 billion kWh. In year 2013, total power consumption was 5.32 trillion kWh, a huge improvement over 2012. Let's hope it keeps getting better in the future.

Why the German gold isn't there

An interesting video about the German gold that isn't there.   Your browser does not support iframes.

It's Europe's Turn to Fudge GDP Numbers

Remember when the U.S. GDP was recalculated 3% higher? If you don't remember, go here to read it . Well, now it's Europe's turn. The European Union's statistics office will revise upwards the EU's annual gross domestic product figures by 2.4 percentage points when it switches to a new accounting standard in September, the European Commission said on Thursday (16 January). What they will include is the same as for the U.S., mainly Research and Development will be added. These things aren't really parts of the economy that are material, but still they will add it to the "GDP". This will have an effect on the "Debt to GDP" levels of Europe and also on the "Spending as a Percentage of GDP" and many other metrics. For our country Belgium it will be an increase of about 2-3% or 10 billion euro. For Finland and Sweden it's an increase of 5% in GDP.  So we magically become richer overnight in September. I wonder when China will start ...

Change in Total Non Farm Payrolls Vs. Job Hires

Image
A Zerohedge article describes how job hires are correlated to the change in payrolls. A discrepancy occurred from 2010 onwards as layoffs went down. 1) The nonfarm payroll number is a measure of the number of U.S. workers in the economy that excludes proprietors, private household employees, unpaid volunteers, farm employees, and the unincorporated self-employed. 2) The job hire number is the amount of people that are actually getting a job per month. So if job hires increase, the amount of workers in the economy increase, if all else stays equal. But the amount of workers in the economy also depends on the amount of layoffs. => Change in amount of workers in the economy (blue chart) = job hires (red chart) - layoffs A discrepancy occurred from 2010 onwards as layoffs went down. So the increase in payrolls was not due to increased hiring, but due to a decrease in layoffs. Conclusion: The importance of monitoring this chart is to know how much of the increase in payrolls is due to h...

Marc Faber Expects Chaos

This Bloomberg video featuring Marc Faber is pretty known out there, but I still wanted to archive it.  I especially like his views on the interest rates limits where the market will break. He talks about 3.5% on the 10 year treasury yield, 5% on the 30 year treasury yield and 6% on the 30 year mortgage yields as the breaking point. Next on I find his comments about the make up of the female interviewer very amusing. Also notable are his short plays on Facebook, Veeva Systems, Netflix, Tesla, Twitter. As a final note, Marc doesn't like Bitcoin. 

Media Ignoring Record Lows in COMEX Registered Gold

Image
I always get a rush when we get a new low in registered gold at the COMEX and today it's bull's eye again. COMEX Gold We hit a new record low of 370 thousand ounces at the COMEX gold. Indeed, leverage is going up exponentially. We are now at ratio eligible to registered gold of 20. And what I find very amazing is that the media is ignoring this in our face. Take for example this article . I quote what they say about silver: Stockpiles of the metal on the Comex on Jan. 8 reached 176.88 million ounces on Jan. 8, the highest since July 1997. In 2013, supplies rose for the third straight year, the longest run in a decade. But nowhere they mention the plunging stock at the gold warehouses. Keep your blindfolds on... P.S.: China is now removing bank restrictions to import gold into China. This exponential curve will only accelerate.

CRB Index Vs. Emerging Markets

Image
I talked about how the emerging markets and especially China depend on commodities. If China does well, the commodities will do well. The mining industry (example Australia) will follow this trend. This means that the CRB index is correlated to the emerging markets. This is illustrated by a nice chart from Ed Yardeni. Apparently Ed believes the commodity supercycle has reached its end since 2011, contrary to what Peter Schiff believes. I do think that the mining industry had a huge boom since 2000 and is now in the process of unwinding. Commodities have been flat because the U.S. dollar was strong. But I don't think the Western world is in such a good shape as Ed thinks, that's why I think this commodity cycle is not over yet.

Buying Japan is Picking Flowers in Front of an Incoming Train

Image
Japan is undergoing a lot of changes today and one of the most important changes to investors is their fiscal situation. In a previous post almost a year ago, I analyzed the dismal fiscal situation in Japan, pointing out how their budget deficits and debt burdens are growing. I want to make an update on that as investors are focusing more and more on Japan these days. The Ministry of Finance Japan has issued a new report on the fiscal situation which can be found here . This report is dated from December 2013. Let's first focus on the trade and current account deficit in Japan. Both have been deteriorating rapidly in 2013. In fact, we are hitting new lows as we speak. The primary reason is that the yen has devalued a lot since 2013. As I noted earlier in other posts , the currency valuation is correlated to the deficit. If the valuation of the currency of a country goes down, that means that they will need to import products at a higher price and they will export products at a low...

Katchum's Macro-Economic Blog Renamed to Correlation Economics

Today is the day we change the blog title. The reason is that I want this blog to be a database of correlations . Don't know if it will work though... Only one way to find out and that is to do it.

Retail Sales Vs. Disposable Personal Income Per Capita

When people have a low disposable personal income (income after taxes) (green chart), they will not go out and buy things. Retail sales (blue chart) will therefore drop. You can also think of it like this. When taxes go up, people have less savings, less disposable income and can't buy much as a result. The amount of stimulus money in household checking accounts also helps spending.   Retail sales need to take into account the inflation rate, so the real retail sales numbers (blue line) are typically lower inflation adjusted.

Why the Federal Reserve Cannot Increase Interest Rates

Image
A very interesting chart from Mish Shedlock. You can see that the Federal Reserve can never raise interest rates as it will spike the interest payments on its debt from the current $400 billion, which can be found here , to over $1 trillion. Interest Impact Comparison As you know, the tax revenues are only $3 trillion at this moment. If interest payments go to $1 trillion, the interest payment as a percentage of tax revenues will go over 30%. Which is even worse than Japan's 25% today. On top of these interest payments, we have several spending programs which will result in a total spending of more than $4 trillion. $4 trillion minus $3 trillion is a 1 trillion deficit/year at least. This means, the Federal Reserve cannot ever increase interest rates. Especially when tax revenues will come down due to the low savings rate and high real unemployment. Not to mention what would happen to adjustable mortgage rates and the housing market, where everyone is now using adjustable rate mort...

COMEX Gold New Record Low

Image
By now it is already baked in what these charts mean, just wanted to update you that we hit a new low in registered gold at COMEX. It is almost at worrying levels now. Leverage continues to go up exponentially at a ratio of 17.5, the highest ever recorded on this chart. I would expect a blowup soon. I have no idea how it will blow up, but blow up it will. Click here to learn about the COMEX default.

China's Power Consumption/Output Vs. Chinese GDP

Image
China becomes increasingly important in our world. It's advisable to follow China's GDP growth because everything depends on it. If China does well, the whole Asian continent will do well, commodities like iron ore, gold, silver, copper will go up. The Australian economy and its currency depend on China. Emerging markets like Vietnam, Taiwan, Thailand, etc... will do good. To predict Chinese GDP growth, we can look at the monthly Chinese power output/consumption numbers because there is a clear correlation here. If the yoy Chinese power consumption (Chart 1: red line) goes up, the GDP growth goes up. Another way to predict China GDP is to look at the credit impulse. The China credit impulse is a leading indicator for China GDP with a 1 year lag.

Copper continues its rise

Image
Historically, when the copper contango is high (red chart tops out), then we have a bottom in the copper price (blue chart bottoms out). Goldman Sachs has traded this trend higher and is closing its  long copper trade now . But the rise in copper could extend a bit. We see the red chart topping out and going in backwardation, which coincides with a lower copper stock at the LME, so we are in the progress of getting higher copper prices. Additionally, when the commercials go long (purple chart goes up), copper bottoms out in the short term. We did have the bottoming out in copper and are now rallying as commercials become short again.  We should now watch out, when will we reach the peak in copper price?

How much does it cost to ship silver and gold?

Image
By now you all know the premiums in Shanghai for silver are 6%. The question is: "Why isn't SLV being raided and sold to the Chinese?". Is it too expensive to ship it over?  Shipping gold and silver costs money. 80% of that money is insurance, so I'm going to neglect the actual shipping costs. I found an interesting post here . To ship 100 oz. gold, requires 4 packages, because you can only insure so much at one time, not more than $25,000 worth. $45 each package. Total cost to ship 100 oz. of gold = $45 x 4 = $180 To compare, it costs $20 to ship 100 oz. silver; $8 for the one box, and $12 for the insurance. Insurance is much less, due to the lower value. Gold is 9 times as expensive as silver to ship, on an ounce per ounce basis at current prices, and more inconvenient, due to having to break down the packaging into 4 boxes. But what about on an equivalent dollar basis, as Antal was saying? What does it cost to ship $100,000 worth of silver verses $100,000 worth of ...

M1 and CPI are Negatively Correlated

A recent article by Henry Bonner of Sprott Global Resource Investment caught my attention. In that article he mentioned Mishka Vom Dorp's comments about money supply and inflation. One quote from Mishka is the following: “First and foremost, an increase in the money supply does not directly result in inflation. In fact, the correlation between increases in M1 – money held by the general public – and inflation becomes apparent only when the timeframe is extended beyond a five year period. Over this longer time frame, the correlation becomes almost perfect." So I wanted to see for myself if what he says is true. I plotted the change in M1 against the change in CPI. To my surprise the correlation is completely the opposite. We have a negative correlation here. Whenever the M1 growth increases (blue chart goes up), the CPI growth actually decreases (red chart goes down). The reason for this is probably that deflation is counteracted by the Federal Reserve by money printing and t...

COMEX Gold and Silver Reporting Interrupted Due To Weather Conditions

Image
Look what I found on the COMEX gold stock today. These weather conditions must be really bad when the internet and phone doesn't work anymore. ONE OR MORE DEPOSITORIES WERE NOT ABLE TO REPORT CHANGES TODAY DUE TO WEATHER CONDITIONS ON THE EAST COAST. Meanwhile the drop in registered gold keeps intensifying.

Technicals for Bitcoin have gotten worse

Image
Remember this post ? It has just gotten worse. Unique Bitcoin addresses have gone to a new low today. While the Bitcoin price has gone up slightly. I wonder when the Bitcoin price will break downwards.