Posts

Showing posts from October, 2019

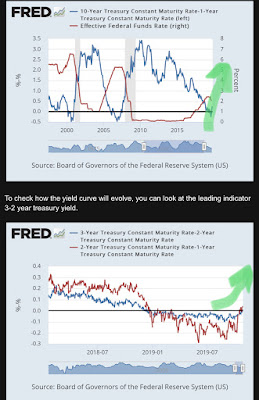
Yield curve uninverts

Image
As predicted a few months ago, the yield curve would uninvert due to QE. Normally a recession would occur, but this is not guaranteed. What is guaranteed is higher inflation and higher stock and gold prices. So prepare yourself now!

Gold Seasonality Positive

Image
We are entering positive gold seasonality.

There is no inflation

Image
A very interesting chart. Normally bond yields and gold price should move together, because inflation would push both higher. But in today's world gold goes up and bond yields go down. This is because there is no inflation. The only reason why gold goes up is because of monetary policy preventing deflation.

ECB balance sheet forecast

Image
This is how the ECB will print money starting in November. 20 billion per month.   This is what the Fed will do. 240 billion in 4 months and 12 billion per month thereafter. Obviously the USD will weaken against the euro in this case.  

Germany buys gold?

Image
As expected, with the end of the CBGA, Western central banks would start buying gold.   We need to stay cautious though as this might be a typo as Bullionstar reports. When we check data.imf.org it indeed was a typo, as September gold holdings were still 108.25m ounces. Central bank gold demand was the highest growing segment in gold demand in 2019.

Repo problems getting worse

Image
Does this look contained to you?

NVT RVT for Bitcoin

Image
The NVT/RVT of bitcoin are like the P/E ratio of stocks. You buy bitcoin when the NVT/RVT is low. You can check this ratio here . Marc De Mesel talks about NVT/RVT:

Money Supply Growth Just Changed To High Gear

Image
Inflation alert!  

Chinese Yuan Vs. China Errors and Omissions in Balance of Payments

Image
To keep track of China capital outflows , we need to look at China’s " errors and omissions " line in its balance of payments. This number represents the residual of the main BOP accounts registering trade and investment flows—in other words, capital that has moved across China’s borders without being documented. The capital outflows accelerated in 2015 and that is when the Yuan started depreciating. So these two are correlated.  

Lynette answers question on Repo and QE

Image
Lynette answers my question: In 2008, we saw a similar uncontrolled spike in the fed funds rate as we see today in September 2019. Only in 2019 it is a much bigger spike with much more debt and deficits. In 2008 we got an immediate QE of $1 trillion in the Fed balance sheet. Do you expect that we could get an even larger QE4 today? If QE1 sent gold above $1000/ounce, then QE4 will send gold above $2000/ounce.

Q2 2019 COFER Update

Image
The U.S. dollar has lost some reserve currency status and is allocated at 61.6%, which is a new low in a decade. The euro has jumped up a bit to 20.3%.

Umich Household Durables Good Time to Purchase Vs. Unemployment Rate

Image
Umich Household Durables - Good Time to Purchase are correlated to the unemployment rate. US consumers spend less on critical household purchases when their economic situation deteriorates; alternatively, the decision to reduce spending on key household products, which may come amid concerns for future income and wealth, creates a feedback loop which ultimately results in an economic contraction. University of Michigan charts can be found here .

CME Group to Launch SGE Gold Futures Contracts Today

Image
Today the CME Group launches Shanghai gold futures contracts linked to the Chinese physical gold market. The spread between China and the West will probably narrow and be more constant as traders can now trade the price difference between London and China. It will also bring the gold futures market closer to the real physical gold market via “Exchange of Futures for Physical” transactions (EFPs).

Endeavour Silver Struggling With Production Issues

Image
The silver price has been rising from $15/ounce to $17/ounce in 2019 while the gold price has risen from $1300/ounce to $1500/ounce. This turnaround should be reflected in the financials of the precious metals miners. Endeavour Silver (EXK) should also benefit from this rise in the price of gold and silver, but the company has been missing estimates on production on 2 of the 4 mines. The outlook isn't particularly rosy when you look at the total production numbers. Total production in Q3 2019 was 5% lower than in Q2 2019. The main problem is attributed to lower plant throughput. However, the gold price has risen 20% and the silver price has risen 15% quarter over quarter. So I expect that the financial results in Q3 2019 will be better than Q2 2019 (earnings neutral). The following chart provides the current production results at the 4 producing mines: Guanacevi, Bolanitos, El Cubo and El Compas. Guanacevi is on track to become profitable again in Q4 2019 as the new orebodies Milac...
QT failed miserably

Image
Assuming that the repos get repaid, the balance sheet of the Fed will go right back to where it started QT by end next year, which means QT failed miserably .

Fed Eases Liquidity Rules

Image
I have been talking extensively about the LCR which is now at 100%, which puts a burden on banks because they cannot use these high quality liquid assets due to the regulation. The Fed now announced they would ease these liquidity rules to about 85%. This is a huge drop in liquidity ratio. Since these banks now have more liquidity, they will probably start using it in the economy (for example loans). This would be good for stocks (especially foreign banks) and inflation.