Posts

Showing posts from December, 2020

Food Inflation

Image
If there is one evidence of inflation, then it's in food. All have been going higher since the stimulus in March 2020. The population hasn't been growing that fast, it's all because of money printing.

Global Negative Yielding Debt

Image
Global negative yielding debt hits record high. Should be positive for gold.  

Copper Deficit to Grow

Image
It is expected that the copper price will rise in the coming decade. To bet on this you can buy Nova Royalties, Oroco Resource or Deep-South Resources.  

China is Booming!

Image
China power consumption for November 2020 was up 9.4%, a record high for the year.

Corporations are flooded with cash

Image
 Corporations have record amounts of cash, which will spur more buybacks. Earnings are expected to balloon.

Fed Dot Plot Signals Rates Staying At Zero

Image
 No rate hike in the near future.

Yardeni Ups Forecast on the Economy

Image
Yardeni upped his forecast again from 4000 on the S&P500 to 4300 on the S&P500. Old: New:

U.S. Treasury Maturity Schedule

Image
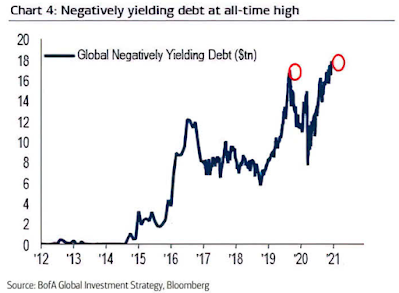
We know the Fed won't let these mature, because then they would have losses at rising bond yields. These will need to be rolled over at higher bond yields. Or they need to print more money to buy them up. For more info read my article . 

Bank Stocks Vs. Yield Curve

Image
The yield curve decides the net interest margin for banks. A rise in the yield curve will make banks more profitable and leads to a rise in the share price of bank stocks.

Gold Mine Production Outlook

Image
 According to Barrick Gold, gold mine production is about to decline. We'll see.

U.S. dollar currency held abroad

Image
 70% of U.S. dollars is held abroad .

Central Banks Printing Money

Image
Central banks keep printing money.

Gold Forecaster Index: Vaccine Optimism Puts Pressure On Gold (04-Dec-2020)

Image
 

Bitcoin Vs. USD

 There is an inverse relationship between Bitcoin and the U.S. dollar.

Oil Inventory Vs. Oil Price

Image
 When oil inventories rise, this means there is a glut in oil. The oil price will go down. Macro-economic indicators from the EIA should be monitored. Refinery net production Weekly oil production Weekly oil stock levels Distillate demand Global oil supply and demand Baker Hughes rig count Weekly supply of petroleum products Make sure to check the uranium price because uranium is a leading indicator for oil. Make sure to check the GDP outlook from the Atlanta Fed.

TIPS Bond Yield Vs. Gold

Image
 Gold and TIPS are correlated.

TIPS Bond Yield Vs. Gold

 Gold and TIPS are correlated.