Posts

Showing posts from June, 2021

Dollar Shorts to be Flushed Out

Image
Shorting the dollar is overcrowded. 

Bank Loans Vs. QE

According to Yardeni , rate hikes won't start until tapering starts. Tapering (blue line) won't start until lending (red line) increases.  

Oil Demand Will Peak

Image
Oil is temporary , copper is forever.

Fed Allows Bank Dividends and Buybacks

The Fed allows banks to buy back shares and issue dividends amounting to $128 billion from July 2021 onwards. Consider the following. A buyback uses cash on the balance sheet of a company to buy back shares, dissolving them and pushing the share price higher. That cash comes into the hands of shareholders and will start flowing into the economy. This in effect is a stimulus to the economy and pushes up asset and consumer prices.

Copper Demand in the Next 25 Years Will Exceed All Copper Demand in History

Image
The copper bull market is still intact. 

Global copper stock levels are at all time lows

Image
When stock levels come down in the second half of the year, copper prices could surge. 

10 Year Break-Even Inflation Rate Vs. CPI

The 10 year break-even inflation rate = 10 year bond - 10 year tips. It represents a measure of expected inflation and is a leading indicator for the CPI.

Glencore CEO on Commodity Bull Market

Image
Glencore's Glasenberg full interview, fast forward to the one-hour eleven minute mark. Summary: Infrastructure spending in both China and U.S.A will boost commodities. COVID-19 continues to impact supply. Lower grades and more difficult jurisdictions impact supply. China stockpile supply is temporary as they need to restock eventually. 80% of the world energy demand needs to be replaced from fossil fuels to renewables. Renewable energy needs to transition: 3000 GW to 26500 GW in 2050 . Solar Panels: 20 times more demand. Electric Vehicles: 18 times more demand to 55 million electric vehicles.   Wind Turbines: 11 times more demand. Copper: 30 million tonnes of demand per year today. 1 million tonnes per year increase per year needed to arrive to 60 million tonnes of copper per year. Nickel: 2.5 million tonnes per year today to increase to 9.2 million tonnes per year. Iron Ore: China is pushing their companies to increase iron ore supply for green energy (wind turbines and elect...

Reserve Balances Vs. IOER

Image
The Reserve Balances at the Fed have been skyrocketing to $4 trillion. The higher this becomes, the higher the IOER needs to be . A hike in IOER is disinflationary  as it incentivizes banks to hold more capital at the Fed (IOER serves as a proxy for the fed funds rate). On the chart below we see that when the excess reserve balance goes higher, either the IOER needs to increase or the Fed Funds Rate needs to decrease .  

GOFO Rates Vs. Gold Price

Image
Koos Janssen points out that when GOFO rates turn negative, the gold price is pushed up due to tight supply in gold. I have compiled the 3 month GOFO rate since 2008, calculated from lease rates  and libor rates . You will notice that the GOFO rate is quickly turning negative and this tells me that the gold price is probably nearing a bottom rather than a top.

Oil is the economy

Image
Real GDP is correlated to the amount of oil we produce/consume. If the Biden administration keeps banning oil projects, this will have consequences for real GDP.

Birth Rate Vs. Inflation CPI

Image
When there are less people, there is less demand for goods and less price pressure.  

China Credit Impulse Craters

Image
China Credit Impulse craters.

Fed Dot Plot June 2021

Image
The Fed is expected to raise rates in 2023. The IOER has been increased to 0.15%. The overnight reverse repo rate has been increased from 0% to 0.05% (which actually exacerbated the reverse repo problem as everyone wants to buy reverse repos and get 0.05% interest). This will actually drain reserves and also decrease lending. Tapering is expected to start in 2022. This is the old dot plot.

China Dumping Copper

Image
China will release its metal stockpiles which it hasn't done since 2010.

China is exporting inflation

Image
China has started to export inflation to the rest of the world.  

China Power Consumption May 2021

Image
China power consumption was strong in May 2021.

Silver to S&P Ratio

Image
The silver price should be much higher. 

US CPI Expected to Reach 7%

Image
More inflation to come.  As China is not sending cheap goods anymore to the U.S.A.

ECB Lagarde Continues Elevated Bond Buying

Image
Lagarde expects to keep buying bonds at a high pace until March 2022. 

Overnight Reverse Repo Exceeds Limit

Image
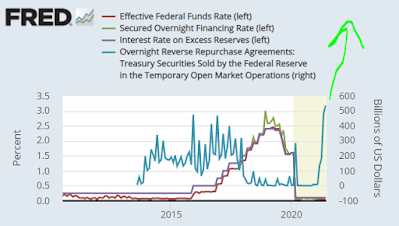
The limit of $500 billion has been exceeded on the reverse repo operations. This tells me there is an imminent USD collapse.  Also, the Fed won't hike rates because it has too many bonds which they would need to pay interest on. So the first thing that will have to happen is tapering of bond purchases . The Fed purchased 54% of the $4.6 trillion increase in the Treasury’s publicly held debt from February of last year through April 2021. The Fed now holds a record 25.7% of the Treasury’s outstanding publicly held debt. And for tapering to happen, Biden needs to stop issuing new infrastructure bills, mortgage moratoria and unemployment checks. Moreover, tapering can only start when lending increases (which it isn't, see chart below), because when you taper, bond yields will rise and lending stops.

Italian Central Bank Buys All Italian Bonds

Image
Pure debt monetization .

Capital Expenditures on Commodities Fall

Image
No expenditures on commodities means higher commodity prices.   Greenfield projects in copper need at least a price of $4/lb to be commercially viable. Short term we will see a supply increase until around 2025, when deficits will start to appear again .

Natural Gas Demand Forecast

Image
Natural gas demand is forecasted to go up 10% in 10 years. That's not a lot...  

Central Bank Digital Currency (CBDC)

Image
Interesting read on CBDC . Prepare to pay negative interest in a cashless society.  

Gold Forecaster Index: Reverse Repo Points To Imminent USD Crash (8-Jun-2021)

Image
 

Central Bank Gold Reserves

Image
Here's an update on central bank gold reserves. Overall we saw an increase in gold demand of 200 tonnes. Notable increases: Japan, Thailand, India, Hungary Notable decreases: Philippines, Turkey  

Tin Market

Image
Tin is a key component for chips and is in short supply right now due to high chip demand. The tin price is now 30000/tonne, which is at the highest end of the cumulative tin production cost curve  (2016). Updated 2019 cost curve  has increased a bit, which means that the tin price will probably stay higher. Updated 2025 cost curve. Tin is produced mainly in Asia . 2021: Indonesia exports are falling. The largest Indeonesia tin producer will not be able to increase production. Myanmar exports are also falling due to political issues. They had been mining at surface tin, but that tin is now all mined out. They will need to mine the lower grade underground stuff now. Production is declining. Tin will be in deficit for at least several years and demand will only increase. Which will put more pressure on stock levels which are hitting all time lows . The supply demand situation looks like this. Demand will outpace supply. Tin is correlated to semiconductor sales, which are b...