Posts

Showing posts from September, 2021

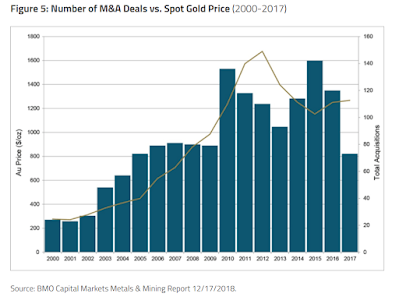
Mining M&A Vs. Gold Price

Image
M&A activity is a leading indicator for the gold price. Today, M&A in the mining space is subdued (especially in base metals), but rising. But M&A is about to boom again.

The "Mannarino" Index

The Mannarino Market Risk indicator was created by Gregory Mannarino in September 2021.  Whenever this indicator is high, stocks don't perform well.  Whenever this indicator is low, stocks shoot up. Lions, as you know- we are going to utilize a new way to gauge market risk, The Mannarino Market Risk Indicator. We are using a scale from 50 to 400 to gauge risk. We derive a “risk number” using this equation- we multiply the DXY by the 10yr Yield and get X. Then we divide X by 1.61 At the time of this writing the Mannarino Market Risk Indicator stands at around 86. Here is a general scale of how to gauge risk. A reading from 50-100 = LOW RISK A reading from 100-200 = MODERATE RISK A reading above 200 = HIGH RISK A reading above 300 = EXTREME RISK. Keep in mind that we need to take in the current environment as a whole, but again in general, the lower the MMRI, (Mannarino Market Risk Indicator), the more risk in we should be taking on in equities. The higher the MMRI the less risk...
FRBNY Total Foreign Gold Deposits Drop

Image
This only happens during depressions.

Peter Schiff Talks About Tapering

Image
By law, the Fed cannot have more than 5% profits per year. Excess earnings are remitted to the Treasury. What happens when the Fed tapers and bond yields spike? The Fed will have losses on its bond holdings. These losses will have to be reimbursed by the Treasury with tax payer money. However, Yellen's wallet is empty right now... That's why tapering is out of the question.  

Chip Shortage

Image
Visualization of the chip shortage. This will be good for tin.  

Gold and silver checklist backup

Image
To be able to time the precious metals market you need to take into account a lot of things. Here is a checklist. 1) Gold Forecaster Index The gold forecaster index is a leading index for the gold price. Always make sure that the gold forecaster index is in positive territory when buying gold/silver. 2) Taylor Rule Rate Inflation starts to appear when the Taylor Rule Rate is above the Fed Funds rate. Only buy gold when the chart is in positive territory. 3) Misery Index Another correlation is that between the misery index and gold. The more misery, the higher the gold price. High unemployment and high inflation are good for gold. 4) Real Output Productivity is negatively correlated to inflation. Whenever productivity slows down, efficiency drops and goods become more expensive to make, resulting in higher inflation, which is good for gold. 5) Supply and Demand Always check that gold and silver demand is higher than the supply of gold and silver. When mine supply goes down, precious met...