Posts

The Effect of War on Silver

Image
Silver ( PSLV , SLV ) is one of the most thermally and electrically conductive materials on this world. Silver is also the best light reflecting element. Silver is being used for war equipment like aircraft and tank engines , automobiles , electrical connections , guns , torpedoes , radiator connections , rockets , warheads , submarines . In fact, silver is essential during wartime periods. Silver-Investor.com points out: "Notice that in a wartime period, silver use increases dramatically. In the nearly 63 years since that review was issued, no substitute has been found in nature for silver and its fantastic characteristics. Many revolutionary uses for silver were discovered as a consequence of war industry research, and what was true in 1942 is truer still today. A modern war machine MUST have silver to function at peak efficiency. Aerospace and jet aircraft technology could not exist without silver, nor could missiles and satellites. Countries which don't have adequate silve...
Another Correlation: What is China's Real Growth Rate?

Image
In the last week of August, Marc Faber gave a signal that all is not well in China . He points out that the Chinese statistics of 7% growth are inflated to the upside. There is a big chance for a hard landing to come in China because many statistics point to a significant slowing of the Chinese economy. For example, in July, industrial production declined sharply (Chart 1). Chart 1: China Industrial Production (yoy) It is very important to know that commodity prices are completely dependent on the growth of China as China is the biggest consumer of commodities in the world. If for example, the U.S. slows down 10%, it would be completely meaningless and wouldn't have any influence on the price of commodities. The reason is that the U.S. GDP consists for 80% of services, which don't use any commodities (Figure 1), while China's GDP consists only for 44% of services (Figure 2). So all eyes should be on China for the commodity investor. Figure 1: Composition of U.S. GDP Figure ...

Got Gold Report August 26: Gold/Silver moving upwards

Image
Got Gold Report has put out another report:  http://www.youtube.com/watch?v=PjkDiavXLTg Interesting to know is that the LCNS for gold is moving upwards again, indicating a higher price for gold (and silver) in the future. Chart 1: Gold LCNS (Got Gold Report) Silver is doing even better (Chart 2). Chart 2: Silver LCNS (Got Gold Report)

Correlation: Australian Dollar Vs. Iron Ore

Image
Another correlation to add to our list: Positive correlation between AUD/USD Vs. Iron Ore price. =>  http://brazilianbubble.com/chart-the-correlation-between-iron-ore-price-and-the-australian-dollar/ Very important correlation to trade on. If you see a disparity like this: You can bet that either iron ore prices will go up, or the Australian dollar will go down. So you can just put your money in both bets, you always win. Reasoning? If you bet the iron ore price goes up and you bet the Australian dollar goes down you will at least get it right for one of the two. It can't be that the gap widens in the correlation, the gap always narrows to the equilibrium point. If iron ore prices do go down, you will at least make money on the Australian dollar plunging. I call this the power of trading on correlation disparity.

Gold: Supply and Demand

Just a note to myself. Eric Sprott has got supply and demand numbers for gold out : http://kingworldnews.com/kingworldnews/KWN_DailyWeb/Entries/2012/8/24_Sprott_-_We_Are_Staring_At_Chaos_%26_Collapse_In_Front_Of_Us.html Gold Supply = 4000 tons/annum Gold Demand = 6500 tons/annum Gold Lease = 2500 tons/annum We'll just have to find out what these numbers mean...

Keith Fitz-Gerald and Chris Martenson on Japan

Image
Keith Fitz-Gerald talks about Japan in this interview with Chris Martenson. The problem in Japan is its enormous government debt, which is 250% of GDP. Its population is very old, 30% of the population is going to die by 2050 and there are very few newborns. He expects the yen to fall due to these dire prospects (200 USD/yen), but notes that the only reason why the yen (and the dollar) are so strong these days is because these two currency markets are the only markets big enough to absorb all this safety haven liquidity (listen at 28:00). More so, Europe has been the event that made investors flee in Japan and the U.S., giving them a little more time to kick the can.

Euro Vs. USD: Take Two

Image
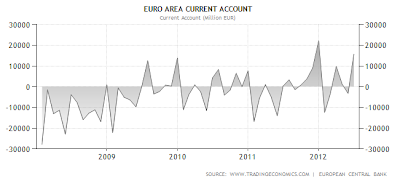
5 months after I wrote the article about the Euro Vs. the USD , it looks like the USD has won the match against the euro. Since April 2012, the euro has lost 5% against the USD. Let's look at what has changed in those months. Following list gives the most important indicators for the future of a currency: Current account balance of the country Total national debt of the country Inflation rate Interest rate If the current account balance of the country is positive, a country will export more than it imports. As the population of the country exports more, they will receive more foreign money. This money will then be converted into their own currency, which is then spent or put in their banks. As the foreign money is converted into the money of the country's population their own currency will appreciate in value. The larger the national debt of the country, the more expensive it will be to sell debt to foreigners. The government will then be obliged to monetize this debt to keep i...