Update: List of all Correlations
I have found many correlations since I started blogging in January 2012.
So I wanted to summarize once again all correlations in this update. Positive correlations mean that if one goes up, the other goes up too. Negative correlations mean that if one goes up, the other goes down.
Positive correlations:
1) Silver premium Vs. Silver Price
2) Baltic Dry Vs. Industrial Commodities
3) Baltic Dry Vs. Copper
4) Copper Vs. S&P
5) Oil Vs. Dow Jones
6) Agriculture Price Vs. Health of Economy
7) Agriculture Vs. Fertilizer Price
8) CRB Index Vs. Commodity prices (oil, agriculture, metals)
9) MZM velocity Vs. Inflation
10) MZM velocity Vs. 10 year U.S. treasury yield
11) Case-Shiller Index Vs. Housing Market Index
12) Capacity Utilization Vs. Inflation
13) Rhodium Price Vs. Automotive Industry
14) Housing Price Vs. Rise of Wages
15) O-metrix Score Vs. Stock Value
16) Outlay Spending Vs. Hyperinflation
17) Gold Money Index Vs. Gold Price
18) Stock Dividend to Bond Yield ratio Vs. Stock Price
19) War Vs. Silver Price
20) Exchange Rate Vs. Treasury Bond Valuation
21) PMI Vs. GDP Growth Rate
22) Gold Lease Rate Vs. Gold Price
23) Economy of Australia/Canada Vs. Industrial Commodities
24) Jim Sinclair's Fed Custodials Vs. Gold Price
25) LCNS silver net short positions Vs. Silver Price
26) ECB Deposit Rate Vs. Euribor and Deposit Facility
27) China Gold Imports from Hong Kong Vs. Gold Price
28) AUD/USD Vs. Iron Ore
29) Chinese yoy GDP growth Vs. Chinese yoy Power Consumption
30) Chinese yoy Power Consumption Vs. Chinese yoy Power Production
31) M1 and Gold
32) Obesity Vs. Debt
33) Global Equity Prices Vs. Global EPS revisions
34) Total Public Debt Vs. Interest Payment on Debt
35) U.S. Bond Yields Vs. Interest Payment on Debt
36) Federal Reserve Balance Sheet Vs. S&P
37) Federal Reserve Balance Sheet Vs. Gold Price
38) Balance Sheet Ratio Fed/ECB Vs. EUR/USD
39) China Manufacturing PMI Vs. Base Metal Prices
40) COMEX stock level Vs. CFTC Open Interest
41) Manufacturing component of Industrial Production Vs. CRB Metals Index
42) Net Short Interest Gold Vs. Gold Price
43) Central Bank Net Gold Buying Vs. Gold Price
44) LCNS silver Vs. Silver Open Interest
45) Bond Yields Vs. Gold Price
46) Gold Miners Bullish Percent Index Vs. GDX
47) Daily Sentiment Index Gold Vs. Gold Price
48) Commercial Net Short Interest Vs. Silver Price
49) Food Stamp Participation Rate Vs. Unemployment Rate
50) Bitcoin Price Vs. Gold Price
51) Credit Expansion Vs. Economic Health
52) Gold Volatility Vs. Gold Price
53) Total Stock Market Index Vs. GDP
Negative correlations:
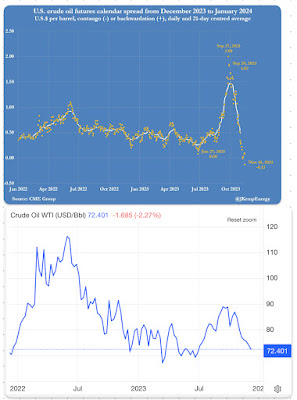
1) Copper Price Vs. Copper Futures Contango
2) Interest Rates Vs. P/E ratio of gold mines
3) Non-Farm Payrolls Vs. Unemployment Rate
4) Federal Debt Held by Foreigners Vs. U.S. Bond Yields
5) Size of Governments Vs. Their Economies
6) Stocks Vs. U.S. Dollar
7) Silver Stock at CME Vs. Silver Price
8) China Reserve Requirements Vs. Shanghai Real Estate Prices
9) Capacity Utilization Vs. Unemployment Rate
10) Net Commercial Short Positions Vs. Bond Yields (Alternative Site)
11) Net Non-Commercial Long Positions Vs. Bond Yields
12) % Change in Gold Vs. Real Interest Rates on 10 Year Treasuries
These are a lot of correlations that you need to monitor on a day to day basis!
So I wanted to summarize once again all correlations in this update. Positive correlations mean that if one goes up, the other goes up too. Negative correlations mean that if one goes up, the other goes down.
Positive correlations:
1) Silver premium Vs. Silver Price
2) Baltic Dry Vs. Industrial Commodities
3) Baltic Dry Vs. Copper
4) Copper Vs. S&P
5) Oil Vs. Dow Jones
6) Agriculture Price Vs. Health of Economy
7) Agriculture Vs. Fertilizer Price
8) CRB Index Vs. Commodity prices (oil, agriculture, metals)
9) MZM velocity Vs. Inflation
10) MZM velocity Vs. 10 year U.S. treasury yield
11) Case-Shiller Index Vs. Housing Market Index
12) Capacity Utilization Vs. Inflation
13) Rhodium Price Vs. Automotive Industry
14) Housing Price Vs. Rise of Wages
15) O-metrix Score Vs. Stock Value
16) Outlay Spending Vs. Hyperinflation
17) Gold Money Index Vs. Gold Price
18) Stock Dividend to Bond Yield ratio Vs. Stock Price
19) War Vs. Silver Price
20) Exchange Rate Vs. Treasury Bond Valuation
21) PMI Vs. GDP Growth Rate
22) Gold Lease Rate Vs. Gold Price
23) Economy of Australia/Canada Vs. Industrial Commodities
24) Jim Sinclair's Fed Custodials Vs. Gold Price
25) LCNS silver net short positions Vs. Silver Price
26) ECB Deposit Rate Vs. Euribor and Deposit Facility
27) China Gold Imports from Hong Kong Vs. Gold Price
28) AUD/USD Vs. Iron Ore
29) Chinese yoy GDP growth Vs. Chinese yoy Power Consumption
30) Chinese yoy Power Consumption Vs. Chinese yoy Power Production
31) M1 and Gold
32) Obesity Vs. Debt
33) Global Equity Prices Vs. Global EPS revisions
34) Total Public Debt Vs. Interest Payment on Debt
35) U.S. Bond Yields Vs. Interest Payment on Debt
36) Federal Reserve Balance Sheet Vs. S&P
37) Federal Reserve Balance Sheet Vs. Gold Price
38) Balance Sheet Ratio Fed/ECB Vs. EUR/USD
39) China Manufacturing PMI Vs. Base Metal Prices
40) COMEX stock level Vs. CFTC Open Interest
41) Manufacturing component of Industrial Production Vs. CRB Metals Index
42) Net Short Interest Gold Vs. Gold Price
43) Central Bank Net Gold Buying Vs. Gold Price
44) LCNS silver Vs. Silver Open Interest
45) Bond Yields Vs. Gold Price
46) Gold Miners Bullish Percent Index Vs. GDX
47) Daily Sentiment Index Gold Vs. Gold Price
48) Commercial Net Short Interest Vs. Silver Price
49) Food Stamp Participation Rate Vs. Unemployment Rate
50) Bitcoin Price Vs. Gold Price
51) Credit Expansion Vs. Economic Health
52) Gold Volatility Vs. Gold Price
53) Total Stock Market Index Vs. GDP
Negative correlations:
1) Copper Price Vs. Copper Futures Contango
2) Interest Rates Vs. P/E ratio of gold mines
3) Non-Farm Payrolls Vs. Unemployment Rate
4) Federal Debt Held by Foreigners Vs. U.S. Bond Yields
5) Size of Governments Vs. Their Economies
6) Stocks Vs. U.S. Dollar
7) Silver Stock at CME Vs. Silver Price
8) China Reserve Requirements Vs. Shanghai Real Estate Prices
9) Capacity Utilization Vs. Unemployment Rate
10) Net Commercial Short Positions Vs. Bond Yields (Alternative Site)
11) Net Non-Commercial Long Positions Vs. Bond Yields
12) % Change in Gold Vs. Real Interest Rates on 10 Year Treasuries
These are a lot of correlations that you need to monitor on a day to day basis!


Comments
Post a Comment